

Published September 2026. Market figures are as reported for the week ending September 11, 2026.
Capacity, not demand, is what changed this year.
In DAT’s reefer report for the week ending September 11, 2026, truck posts were 34.5 percent lower than a year ago. The national reefer load-to-truck ratio stood at 19.00 compared with 8.84 a year earlier, while reefer spot linehaul averaged $2.71 per mile excluding fuel, up 35.0 percent year over year. Diesel added a second squeeze: the EIA’s on-highway average hit a record $6.285 per gallon on September 14, up 31.8 cents from the previous week and $2.546 from a year earlier.
The obvious conclusion is that temperature-controlled freight costs more. The less obvious one matters more: when the constraint is the number of trucks rather than their price, negotiating harder on rate is the weakest lever available.
Below is how to read the market correctly, the four levers that still work when capacity is the binding constraint, what to include in a temperature-controlled tender, and what a food logistics partner can do that a carrier quoting a lane cannot.
What you’ll learn
- Which market number actually tells you about capacity, and which one misleads
- Why a fuel increase costs a refrigerated load more than a dry one
- Four levers that work when trucks, not rates, are the constraint
- What to specify in a temperature-controlled tender so quotes are comparable
Index
- What the market is actually telling you
- The second squeeze: record diesel and the reefer double burn
- Four levers food shippers still control
- What to specify in a temperature-controlled tender
- Where the international leg fits
- What a food logistics partner does that a carrier cannot
- Frequently asked questions
- Summary
What the Market Is Actually Telling You
Most freight market coverage leads with the rate. But The rate is the least diagnostic number in the report.
Read the ratio, not just the rate
The load-to-truck ratio compares load postings with truck postings on a load board. It shows which side of the market is scarce, something a rate alone cannot reveal: a rate can rise because more freight appeared or because fewer trucks were available, and those scenarios call for opposite responses.
For the week ending September 11, DAT reported the national reefer ratio at 19.00, compared with 8.84 a year ago. Reefer load posts fell 22.3 percent on the week as Labor Day interrupted produce shipping, but remained 40.7 percent above last year, while truck posts were 34.5 percent below last year.
This is a capacity story, and it is not only a reefer story
The year-over-year truck post figure is the one to focus on. Carriers have left the market, and they have left the dry van market as well.
Week ending 11 September 2026
| Reefer | Dry van | |
|---|---|---|
| Spot linehaul, excluding fuel | $2.71/mile | $2.20/mile |
| Year-over-year rate change | +35.0% | +34.2% |
| Load-to-truck ratio | 19.00 | 10.95 |
| Ratio a year ago | 8.84 | 5.33 |
| Truck posts vs. a year ago | -34.5% | -40.2% |
Source: DAT Freight & Analytics reefer and dry van reports, published 15 and 16 September 2026.
It would be convenient to say reefer is tight while dry van is soft. The data does not support that, and a plan built on it would fail. Both are running well above last year on a thinner carrier base. What separates them is level, not direction: the reefer ratio is roughly 1.7 times the dry van ratio, and the spread between the two linehaul rates is about 51.0 cents per mile.
Why it lands harder on food
General tightness lands on food freight on top of three things specific to it. The carrier pool is smaller to begin with because a reefer trailer is a larger capital item and the work is more demanding. The fuel bill is paid twice, which the next section covers. And the cargo cannot wait: a dry load that misses a day costs a day, while a refrigerated load that misses a day can cost the load, and on an import the lot.
The Second Squeeze: Record Diesel and the Reefer Double Burn
The EIA put the U.S. on-highway diesel average at $6.285 per gallon on September 14, 2026, up 31.8 cents from the previous week and $2.546 from a year earlier. West Coast diesel reached $7.250 per gallon, up 26.3 cents on the week.
A refrigerated move burns fuel twice: in the tractor and in the transport refrigeration unit (TRU) that maintains the temperature inside the trailer. The TRU runs whether the truck is moving or parked at a receiver, so detention that is merely annoying on a dry load also burning fuel on a reefer load. When diesel rises 30.0 cents in a week, a temperature-controlled lane absorbs more of that move than a dry lane of the same length.
What to check in a fuel surcharge clause
Most surcharge schedules pegged to the EIA weekly series, which is published Monday afternoon for the preceding week. That creates a lag: this week’s surcharge reflects last week’s fuel price. In a flat market, the lag nets out. In a week when fuel move by 30.0 cents, it does not, and whoever holds the rate absorbs the difference. Five things decide who that is.
- The index. Which series, national or regional. A West Coast lane pegged to the national average can be mispriced in both directions.
- The base price. The fuel price at which the surcharge is zero. An old base price can quietly inflates every subsequent surcharge.
- The peg. How many cents of fuel-price movement triggers how many cents per mile of surcharge?
- The update frequency. Weekly, monthly, or at invoice. Monthly updates in a volatile quarter can create material exposure.
- Floors and caps. Whether either side is protected, and at what level.
Ask separately whether the schedule accounts for the refrigeration unit at all. Many do not, which means TRU fuel cost is either buried in the linehaul rate or absorbed by the carrier until the rate is renegotiated.
Four Levers Food Shippers Still Control

When the constraint is capacity, rate negotiation has limited room. These four have more.
Change the mode, not just the rate
A lane priced as truckload is not necessarily best served by truckload. Intermodal rail, consolidated LTL, and drayage each have a window where they win on landed cost, and a fuel spike moves those windows. The test is not which mode is cheapest per mile, but which delivers within the product’s time and temperature tolerance at the lowest total cost. That is worth calculating rather than assuming. Our domestic transportation team uses Oracle Transportation Management for cross-mode rate comparison across truckload, intermodal rail, LTL, refrigeration transportation, flatbed, and drayage.
Fix the fuel clause before the next spike
Of the five clause elements above, the base price and the update frequency are the two most often left at whatever the last contract said. Both are negotiable, and both are worth more in a volatile quarter than a few cents on the linehaul rate.
Consolidate and pool
When trucks are scarce, the shipper who needs fewer of them wins. Freight consolidation, pool distribution and multi-stop routing all reduce the number of separate capacity commitments you need to secure, which matters more as tender acceptance is fall. The trade is schedule discipline: consolidation only works if order cutoffs hold.
Rebalance contract and spot
In a capacity-constrained market, what’s worth locking in is access, not only price. A contract that a carrier will not honor during a tight week is not capacity. Watch tender acceptance rather than contracted rates, extend lead times where the product allows, and be honest about which lanes genuinely need spot flexibility.
| Lever | Works when | Constraint |
|---|---|---|
| Change the mode | Time tolerance exists and distance is long | Temperature-capable equipment must be available on that mode |
| Fix the fuel clause | Contracts are up for renewal | Applies at renewal, not mid-term |
| Consolidate and pool | Many small shipments, clustered destinations | Requires firm order cut-offs |
| Rebalance contract and spot | Volume on a lane is predictable | Volume commitments cut both ways if the market turns |
Not sure which of these applies to your lanes?
Send us one temperature-controlled lane and we will come back
with a mode, cost and timing comparison for it.
What to Specify in a Temperature-Controlled Tender
Quotes are comparable only if the requirement are specified the same way. The following six items determine whether they are truly comparable:
- Set point and tolerance. Specify a number, not “frozen” or “chilled”.
- Continuous or cycle operation. These involve different fuel and temperature profiles, and carriers price them differently.
- Pre-cool requirement. Specify who pre-cools the trailer, to what, and for how long before loading.
- Temperature recording. Specify the device type, placement, download responsibility, and records retention period.
- Detention and reefer runtime. Specify whether the TRU running during detention is billable, and to whom.
- Exception procedure. Specify who is called, within how long, and what happens when a temperature alarm fires in transit.
Where storage is part of the plan, confirm what the provider actually operates. Refrigerated storage, ambient food-grade storage and a replenishment point where dry ice or gel packs are exchanged are three different things. Only the first is designed to hold products at temperature for days.
Where the International Leg Fits
For importers and exporters, the domestic market is one segment of a longer chain, and it is at the handoffs between segments where time is lost.
Reefer ocean, air, and the handoff to domestic
Nissin offers NVOCC services to and from the United States with reefer container capability, alongside air and ocean options to more than 400 global locations, door to door. The value of arranging both legs together is that the arrival date generated by the international leg becomes the date against the domestic reefer must be booked, in a market where booking late costs more than booking incorrectly.
Customs timing is a shelf-life question
On perishable freight, a customs or partner government agency review is not an administrative delay. It is a deduction from the shipment’s remaining shelf life. Our guidance on temperature-controlled shipping containers covers what can and cannot be done to a shipment while it is being held, including replenishing cooling in a bonded facility.
The margins are narrower than most people outside the trade expect. On one export program we operate, the fruit has to leave the United States within 12 hours of leaving the cold warehouse. That is not a service level. It is a property of the product.
What a Food Logistics Partner Does That a Carrier Cannot
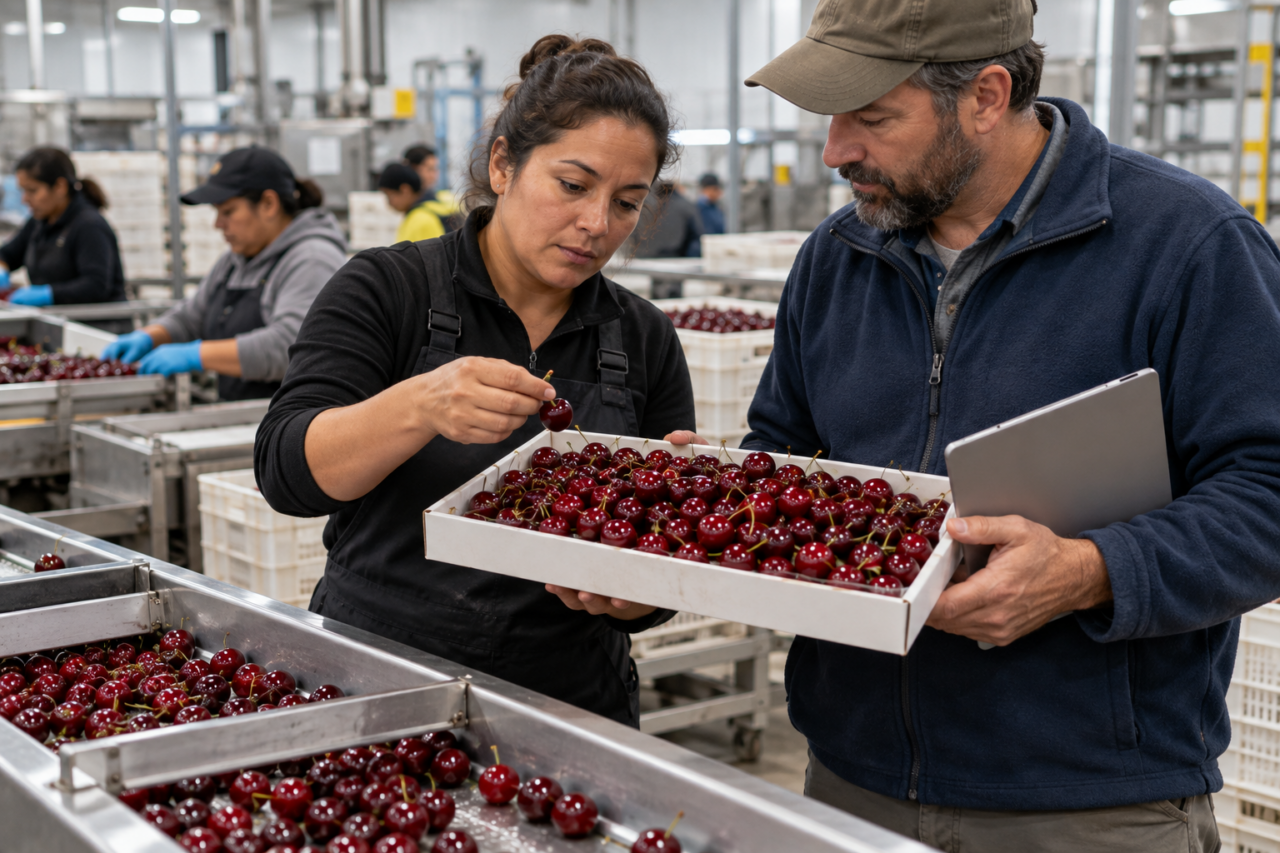
A carrier sells movement between two points. The problems above do not arise between two points.
Take a customer we have written about separately. A family-owned grower in California’s Central Valley produced exceptionally high-quality cherries but sold only to distributors, with no control over the brand, pricing or destination. The grower wanted to export directly to Japan, where the cherry market was mature and consolidated. Established buyers were reluctant to take an unknown supplier, and earlier approaches had gone nowhere.
What changed the outcome was not a freight quote.
Year one, introduction. Our food commodities team found the grower through a niche industry publication and cold call. Recognizing the quality of the fruit, our Food Commodities Director introduced the grower to a long-term Japanese importer looking for brand differentiation. The importer agreed to a trial shipment, largely on the strength of decades of trust with Nissin. The first season was challenging, with a third party’s packing house causing communication issues and errors in the documentation.
Year two, operations. To grow, the grower needed its own packing house, a steep learning curve for a family business. Our staff went on site as a temporary operational partner, covering cold chain integrity from farm to airport, customs compliance including the market-specific documentation and labels requires for each destination, and coordination of refrigerated trucking with time-critical air freight. We also took over day-to-day communication with the Japanese buyer: ready-to-ship volumes, pricing and delivery schedules.
Year three, position. The grower’s brand became a recognized premium product in Japan under an exclusive arrangement for Grade 1 fruit. The importer grew into the top tier of Japanese cherry importers. In 2024, the grower entered the U.S. domestic market for the first time and expanded into Korea and Southeast Asia.
That sequence requires a particular combination, and it is worth naming plainly. Nissin International Transport U.S.A., Inc. is a freight forwarder and licensed U.S. customs broker with 45 years of experience in perishable and frozen food, and is part of a group operating in 24 countries. Domestically: truckload, intermodal rail, LTL, refrigerated trucking, flatbed and drayage, with cross-mode rate comparison. Internationally: NVOCC reefer, air and ocean, door to door. Our warehousing is security compliant with OSHA, CTPAT and Food Grade Certification, covering dedicated and shared storage, pick and pack, fulfillment and e-commerce, and real-time inventory visibility. Our customs practice covers USDA and FDA requirements across meat, poultry, seafood and produce.
We do not own trucks or operate refrigerated storage in the United States, and we will say so before you ask. What we do is put the mode, the international leg, the customs entry and the warehouse step into one plan, and stay with the plan when things hit a bad week.
Frequently Asked Questions
Why are reefer rates up so much this year?
Because carrier capacity has left the market. In DAT’s report for the week ending September 11, 2026, reefer truck posts were 34.5 percent below a year earlier and the national reefer load-to-truck ratio stood at 19.00 against 8.84. Reefer spot linehaul averaged $2.71 per mile, excluding fuel, up 35.0 percent year over year. Dry van showed the same pattern, so this is a truckload capacity story rather than something unique to refrigerated freight.
How much of a diesel increase does a refrigerated load actually absorb?
More than a dry load of the same length, because a refrigerated move burns fuel in the tractor and again in the transport refrigeration unit, which also runs while the truck is stationary. Whether that reaches your invoice depends on the surcharge clause: check the index, the base price, the peg, the update frequency, and whether the schedule accounts for the refrigeration unit at all.
Should I move temperature-controlled freight to intermodal rail?
Sometimes, and it should be calculated rather than assumed. Intermodal can win on landed cost over longer distances when the product tolerates the extra transit time and temperature-capable equipment is available on the lane. Test it against shelf life and the cost of inventory in transit, not the per-mile rate alone.
What should a temperature-controlled tender specify?
Set point and tolerance as a number, continuous or cycle operation, the pre-cool requirement and who performs it, temperature recording and who retrieves the record, whether refrigeration unit runtime during detention is billable, and the exception procedure if an alarm fires in transit. Without those, quotes are not comparable.
Summary
- The change this year is capacity, not demand. Reefer truck posts were 34.5 percent below a year ago in the week ending September 11, 2026.
- Dry van shows the same pattern. What is distinctive about reefer is the level and the consequences, not the direction.
- Record diesel costs a refrigerated load twice, and the surcharge clause determines who pays for the lag.
- When trucks are the constraint, mode selection, fuel clause terms, consolidation, and tender discipline can have a greater impact than rate negotiation.
- Specify the tender properly, or the quotes you compare are not be describing the same service.
Cold chain problems rarely stay within one function. A capacity problem becomes a warehouse problem, a customs delay becomes a shelf-life problem, and a fuel clause becomes a budget problem. Our team can look at your lanes, import flow, and storage together, then come back with options rather than a single quote.
Disclaimer
Freight market data in this article is drawn from the sources cited and reflects the weeks indicated in September 2026. Spot rate indices, load-to-truck ratios and fuel prices change weekly and should be re-checked against the original source before being used in a budget or contract. DAT rate figures are linehaul only and exclude fuel. Where this article draws a conclusion from published data rather than restating it, that is identified in the text.
Nissin International Transport U.S.A., Inc. is a freight forwarder and licensed U.S. customs broker. Nothing in this article constitutes legal, regulatory or food safety advice. Requirements for a given product depend on its classification, origin, and the agencies with jurisdiction. Confirm those requirements with your quality, regulatory or legal team.
References
- DAT Freight & Analytics. Reefer report: South Texas breaks higher as California cools, 16 September 2026. https://www.dat.com/blog/reefer-report-south-texas-breaks-higher-as-california-cools
- DAT Freight & Analytics. Dry van report: The freight is moving, just not where it used to, 15 September 2026. https://www.dat.com/blog/dry-van-report-rates-ease-on-a-holiday-shortened-week-but-capacity-keeps-them-near-the-top-of-the-range
- U.S. Energy Information Administration. Gasoline and Diesel Fuel Update, week of 14 September 2026. https://www.eia.gov/petroleum/gasdiesel/
- Nissin International Transport U.S.A., Inc. Growing Together: How Nissin International Transport USA Unlocked Premium Export Markets for a Customer, case study, January 2026.
